
Shadow Indicators
How Obscure Economic Signals Provide Unexpected Clarity

Anyone following the events unfolding in Iran will likely have read headlines on surging oil prices. The price of oil has taken center stage in much of the discussion around global markets and rightly so. However, the price of oil is in itself a reflection of other precursors that any investor can track.
In the early weeks leading up to the recent strikes on Iran, a set of economic and logistical signals, sometimes overlooked by mainstream analysis, anticipated the escalation with uncanny clarity.
Dubbed “shadow indicators” by geopolitical analysts, these measures operate outside conventional economic reporting, providing early warning signs of wartime stress and potential disruption.
For investors and policymakers alike, understanding these signals offers both foresight and a lens through which the implications of conflict can be assessed.

The Most Critical Shadow Indicators
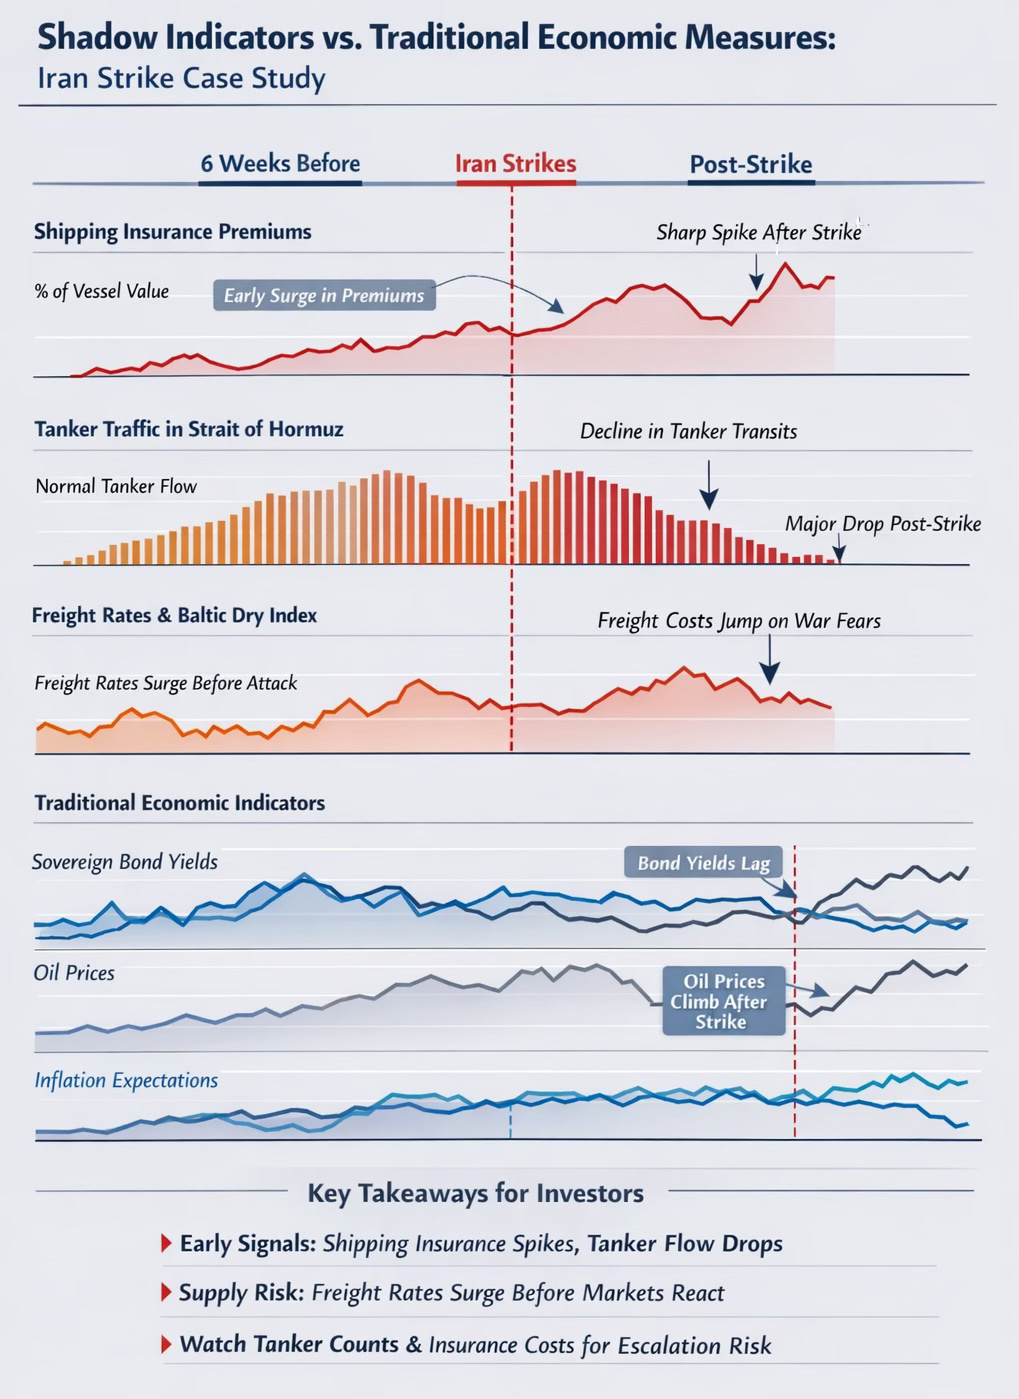
The three to four most critical shadow indicators during the Iran crisis are shipping insurance premiums, energy export flows, and logistics congestion & freight rates in strategic maritime corridors. Each offers a real-time glimpse into the operational risks and economic stresses building in the region.
Shipping Insurance Premiums: Maritime insurers reacted swiftly to rising tensions, expanding war-risk zones and sharply increasing premiums for vessels transiting the Persian Gulf. Before any public reports of military strikes, premiums had already multiplied severalfold, signaling the market’s anticipation of imminent conflict. These insurance movements are particularly revealing because insurers price risk with access to detailed intelligence and actuarial models, making them far less susceptible to political noise than conventional reporting.
Energy Export Flows: The Strait of Hormuz, through which roughly one-fifth of global oil supplies transit, saw early disruptions even before open hostilities. Tanker rerouting, delayed loading, and anticipatory congestion reflected the likelihood of supply interruption. Unlike official production or export statistics, which are often delayed or manipulated, these flows provide near real-time insight into the functional state of the energy market and, by extension, the war economy.
Logistics Congestion and Freight Rates: Vessel movement data (e.g., Clarkson’s Tanker Index, Freightos Baltic Index), including AIS tracking of tankers and commercial freighters, revealed hesitation and congestion in key corridors. Freight rates surged in anticipation of risk, reflecting not only the perceived probability of disruption but also the broader market’s adjustment to potential bottlenecks.
These indicators capture behavior that precedes formal news reports or government statements, providing a window into the early-stage activities of wartime economies.
Shadow Indicators vs. Traditional Economic Measures
There are two reasons to highlight these obscure indicators. First, to showcase how they can help manage portfolio risk; and second, to contrast them with more backward looking signals.
The reality is that traditional economic indicators such as sovereign bond yields, consumer price indices, and GDP data, are often slow to reflect the stresses of conflict (as shown in the diagram below).
Sovereign debt rates, for example, may rise only after markets have digested the political and fiscal implications of war. Similarly, official energy production reports or trade statistics lag weeks behind actual disruption, obscuring early warning signs.
Shadow indicators, by contrast, emerge directly from operational risk and supply chain behavior, allowing investors and analysts to detect shifts before official data or headline news confirms them.
Risk Tool
For investors, these shadow indicators serve as a potent risk signal and a tool for strategic positioning:
Early recognition of supply shocks: Rising shipping premiums and blocked energy flows can point towards commodity price volatility, particularly in oil, LNG, and related derivatives.
Maritime logistics disruption: Bottlenecks in strategic corridors signal potential ripple effects in global trade, which may impact shipping equities, port operators, and industrial commodities.
Sovereign credit risk lag: While bond yields may eventually reflect the increased fiscal risk of wartime expenditure, shadow indicators provide a head start in assessing the economic resilience of the state and the likely trajectory of market stress.
Shadow indicators offer a uniquely predictive view of conflict dynamics, highlighting operational and financial stress points before traditional metrics.
For the Iran strike, shipping insurance premiums, energy flows, and maritime logistics patterns foreshadowed escalation weeks before headlines confirmed it.
Investors who incorporate these signals into their analysis gain a strategic advantage, navigating volatility with insight rather than hindsight. In a world where wartime dynamics can shift markets almost instantaneously, understanding the unseen currents of economic behavior becomes a risk management necessity.
This publication is for brains, not bets. The Other Side of Obvious shares ideas, stories, and general financial information - not personalized investment, tax, or legal advice. Investing comes with risk (including losing money). Talk to a pro before you act. Please take time to read these important disclosures before you get started.