

The price of stocks, much like consumer goods, is a function of supply and demand. The supply of stocks, for the most part, stays relatively constant (apart from IPOs, acquisitions or mergers.
On the demand side, stock prices reflect the gap—positive or negative—between expectations and reality (i.e., between how the company is expected to perform by industry analysts and how it actually performs). At least, that’s how it’s supposed to work in normal environments.

Investors might wonder whether the market is behaving “normally” after Alphabet’s stock suffered its worst day in its history last Thursday. GOOGL 0.00%↑ erased $500 billion of market value. And this occurred on the back of relatively strong revenue (+25%), but below expectations, slightly; Cloud and Search revenues were both up. However, free cash flow was down considerably more than expected.
So, is this normal behavior? Yes.
But why, when Alphabet was not far off expectations? Because expectations are not simply an objective fixed number. They act on a subjective gradient.
People are expectation machines. And people can be more or less demanding.
Gradient Scales
Expectations entering Q3 2026 were considerably higher than they were entering Q3 2025. Bars have been raised—demands have gone up. Not randomly, but based on multiple variables, such as historic earnings, company development, economic, political, regulatory conditions and competitive factors. In fact, Q3 earnings growth expectations for US stocks increased from 26.7% at the end of June to 29.5% at the end of September.
Arriving at objective earnings estimates requires the incorporation of subjective layers. It's a gradient that plays as much on a company’s size and business as it does how many actual widgets are sold. Markets don’t punish widget companies that fail to hit their profits as much as they will a behemoth, like Alphabet, that shows potential signs that it may not be able to make as smooth a transition from search engine ad revenue to AI-generated revenue as first thought.
The price for failing to perform, even in the slightest, can be catastrophic, as Thursday’s and Friday’s market blood bath proved.
Hyper-Scaled Demands
Given the ongoing bubble narratives surrounding the “hyper-scalers” and the emerging AI-age, investors should understand that analysts—people, just like you and I—also become hyper-demanding.
In my recent tongue-in-cheek article, I satirically poked at the pessimism and dourness of so many market bears and bubblers. When, in reality, this negativity is just what the market needs to move forward. Last week’s market outcome was bad, short term, but a tale-tell sign that markets are working as they should. Bull markets climb a wall of worry, not a wall of euphoria.
Only take note: hyper-sensitivity is currently a signal that volatility will continue through the quarter. One wrong move, and sellers are ready to pounce.
Why? Because of the negative narratives coupled with hyper-demands.
People are expectation machines. And people can be more or less demanding.
The important point is that investors should see what these hyper-demands reflect: the fact that analysts are expecting more from company earnings growth tells you that the market is expecting more economic growth, not less. The economy is healthy!
In other words, the current wrangling in the market is over how healthy, and not whether it will survive.
Beat-Rate vs. YoY Earnings
As of October 30, FactSet reports 82% of S&P 500 companies who have reported Q3 earnings have beat their EPS estimates. That “beat-rate” exceeds both five-year and ten-year averages. In others words, that’s good!
The earnings backdrop is considerably stronger than a year ago. And not merely amongst technology companies. However, the demand bar is rising. So, how should investors deal with rising expectations?
Rather than focusing exclusively on the percentage of companies beating estimates, long-term investors should consider this:
What is the % of companies reporting year-over-year (YoY) earnings growth?
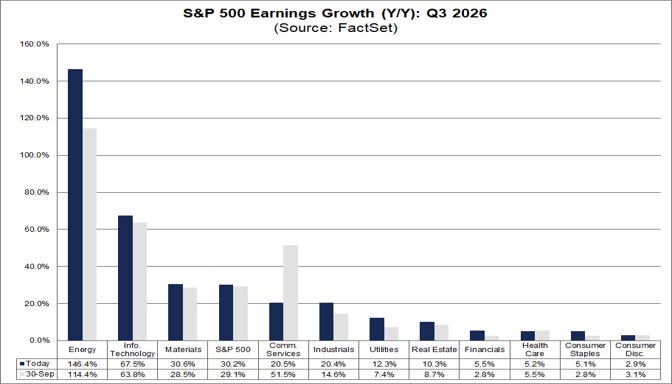
As the of the latest available data, the S&P 500 is reporting YoY earnings growth across 11 of 12 sectors, from energy to consumer discretionary. Only communication services has lagged. Of course, not every company is growing earnings. However, the overall trend is one that helps to explain why demands for more earnings has risen.
More importantly, it points to more upside, than not.
Adding this perspective addresses whether companies are actually becoming more profitable, as opposed to merely outperforming relatively conservative analyst forecasts.
That is the sort of reality smart investors should look for.
This publication is for brains, not bets. The Other Side of Obvious shares ideas, stories, and general financial information - not personalized investment, tax, or legal advice. Investing comes with risk (including losing money). Talk to a pro before you act. Please take time to read these important disclosures before you get started.